
Decision Analyst’s Economic Index U.S. Census Divisions September 2018
Arlington, Texas—The West North Central and the South Atlantic tied for the highest Index score for September (120). (Hurricane Florence hit the Carolinas in mid-September, 2018; data for this survey was collected starting on September 20th.) The South Atlantic increased 6 points in the past 12 months, while the West North Central increased 4 points. The New England Census Region had the lowest Index with a score of 114; and it saw no change in the past 12 months. Additionally, the East North Central Region also saw no change in the past 12 months.
United States Economic Index
The Decision Analyst U.S. Economic Index stands at 116 for September 2018, a 1-point increase over the past 12 months, but a 3-point decline from August 2018. The U.S. Economic Index has flattened out over the past year, suggesting that the U.S. economic expansion might be reaching its apex. The overall trend of the Economic Index suggests slowing growth, and raises the prospect that the current economic cycle may be reaching a turning point—a turn toward recession. The Economic Index tends to foreshadow overall U.S. economic activity by 6 to 12 months. Below is the past-10-year history of the U.S. Economic Index.
“The U.S. Economic Index is beginning to signal slower growth, or perhaps a coming downturn in the U.S. economy. Trade disputes, tariffs, and threats of tariffs are disrupting sectors of the U.S. economy, and the continuing rise in interest rates is beginning to take its toll on credit-sensitive industries, such as housing, construction, and automotive. The strengthening U.S. dollar is raising the risks of financial crises in emerging economies around the world. Once the flames of financial crises begin, they can quickly spread to developed economies. The growing mountains of corporate and governmental debts are major risk factors to the U.S. economy,” said Jerry W. Thomas, President/CEO of Decision Analyst. “The dangers of recession or ultraslow growth are lurking in the shadows.”
Index History
The division-by-division results are presented in the graphs below. Remember, the Census Division graphs portray 3-month moving averages.
*Census Division Three-Month Moving Average
The Index numbers for the census divisions are three-month moving averages to smooth out fluctuations due to smaller sample sizes. The reported Index number averages the current month with the two previous months.
Methodology
The Decision Analyst Economic Index is based on a monthly online survey of several thousand households balanced by gender, age, and geography. The scientific survey is conducted in the last 10 days of each month. The Economic Index is calculated from 9 different economic measurements using a sophisticated econometric model. The result is a snapshot of coming economic activity in each country surveyed, as seen through the eyes of representative consumers living in the respective countries.
Decision Analyst conducts its concurrent economic surveys each month in Argentina, Australia, Brazil, Canada, Chile, Colombia, France, Germany, India, Italy, Mexico, Peru, the Russian Federation, Spain, and the United States. Whenever the Decision Analyst Economic Index is greater than 110, it tends to signal an expanding economy. An Index value of 90 to 110 suggests a no-growth or slow-growth economy, and near or below 90 generally indicates economic contraction. These guidelines vary by country, however.
About Decision Analyst
Decision Analyst (www.decisionanalyst.com) is a global marketing research and analytical consulting firm specializing in strategy research, new product development, advertising testing, and advanced modeling for marketing decision optimization. For over 40 years, the firm has delivered competitive advantage to clients throughout the world in consumer packaged goods, telecommunications, retail, technology, medical, and automotive industries.
Media Contact
Cristi Allen
Publicity
Email: callen@decisionanalyst.com
Phone: 1-800-ANALYSIS (262-5974) or 1-817-640-6166
Address: 604 Avenue H East
Arlington, TX 76011
Download the PDF File
Library
Interactive Economic Index
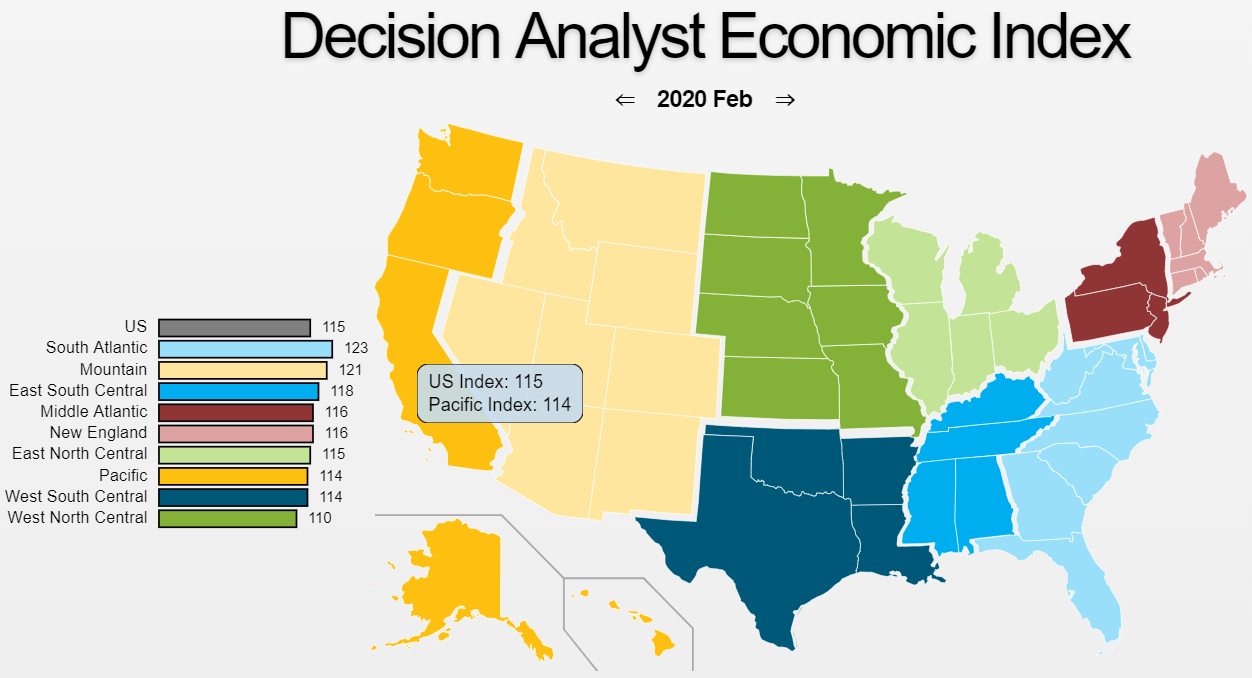
Click on the map above to open Decision Analyst's Interactive Map for the United States and its nine census divisions.
Logos & Images
If you are doing a story on Decision Analyst or using any of our published data, news releases or articles, you must cite "Decision Analyst" as the source of the information.
If you use any of the charts or tables from the press releases or other published materials, please email Cristi Allen at callen@decisionanalyst.com to let us know which graphics you took and for what newspaper, magazine, or website it was used.