
U.S. Economic Recovery Stalls Out
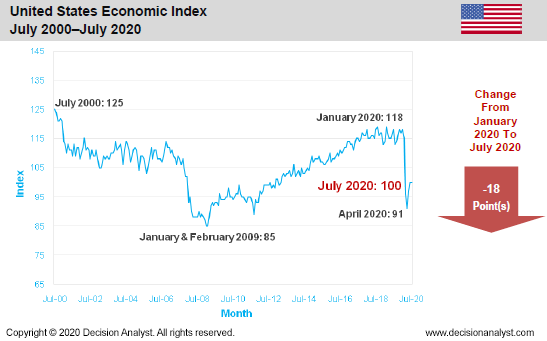
Arlington, Texas—The Decision Analyst U.S. Economic Index was the same in July 2020 as it was in June 2020. However, since the January‒February time period (before coronavirus), the U.S. Economic Index is down 18 points, a stunning decline. The U.S. economy plunged in March and April of this year, but it began to trend up in May and June as the U.S. economy began to reopen. However, the July data suggests that the uptrend is stalling out. This implies that the U.S. economy will be in recession for the balance of the year, at a minimum. The Index tends to be a leading indicator of future economic activity. The U.S. Economic Index for the past 20 years is shown below.
“The leveling off of the Economic Index in July suggests that the beginning recovery is being undermined by the resurgence of COVID-19," said Jerry W. Thomas, President/CEO of Decision Analyst. “Another indicator that all is not right with the U.S. economy is the jump in the Decision Analyst U.S. unemployment statistic for July, as shown in graph below. The initial wave of layoffs, however, is not the whole story. We are only in the first inning of large corporate layoffs. We will see a steady stream of layoff announcements by corporate America during the waning months of 2020," said Thomas. Decision Analyst’s unemployment numbers tend to average 2‒3 percentage points higher than Bureau of Labor Statistics (BLS) numbers because of differences in methodology, but this pattern reversed in April 2020, when the official unemployment rate published by BLS soared to 14.7%.
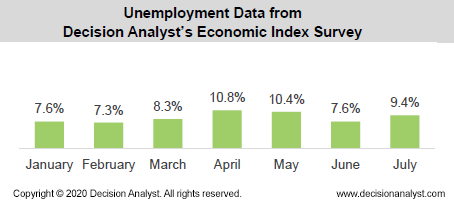
“In Decision Analyst’s Economic Index survey, U.S. adults have to self-classify their employment status. They have to say they are ‘unemployed but looking for a job’ to be counted as unemployed. The BLS June number was 11.1%, higher than Decision Analyst’s unemployment number of 7.6% in June. The Decision Analyst’s unemployment number increased to 9.4% for July, while the BLS decreased for July to 10.2%. The lower self-reported unemployment rate by Decision Analyst suggests that fewer residents of the U.S. really think of themselves as unemployed compared to BLS data—which is focused on whether the person was unemployed during a specific one-week period each month. If fewer people actually think of themselves as unemployed, they might be likely to start spending or keep spending. This might be a positive for the future.
“However, planned future purchases (see graphs below) continued, on average, to trend lower than the pre-COVID January‒February period," said Thomas. "This softness might be a reflection of concern over the rapid increase in COVID-19 cases in the U.S. during the last two weeks of June and the whole month of July. The graphs below show the percentage of U.S. households who say they are likely to do the following in the next 12 months.”
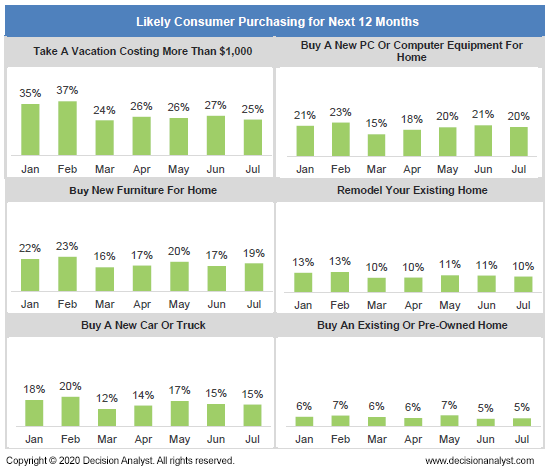
"The data suggests that consumers are worried about the future—based on waning future purchase plans. Of particular note is the big decline in expensive vacation plans. Home furniture and home remodeling have held up reasonably well, as people try to make home isolation more tolerable. New PCs or computer equipment purchase intent is also holding up reasonably well. With so many people working at home, many may be needing (or wanting) to upgrade their current computer equipment. Sales of new cars and trucks look to be in a slump for the rest of 2020," said Thomas.
Methodology
The Decision Analyst Economic Index is based on a monthly online survey of several thousand households balanced by gender, age, and geography. The scientific survey is conducted in the last 10 days of each month. The Economic Index is calculated from 9 different economic measurements using a sophisticated econometric model. The result is a snapshot of coming economic activity in each country surveyed, as seen through the eyes of representative consumers living in the respective countries.
Decision Analyst conducts its concurrent economic surveys each month in Argentina, Brazil, Canada, Chile, Colombia, France, Germany, India, Italy, Mexico, Peru, the Russian Federation, Spain, and the United States. Whenever the Decision Analyst Economic Index is greater than 110, it tends to signal an expanding economy. An Index value of 90 to 110 suggests a no-growth or slow-growth economy, and near or below 90 generally indicates economic contraction. These guidelines vary by country, however.
About Decision Analyst
Decision Analyst (www.decisionanalyst.com) is a global marketing research and analytical consulting firm specializing in strategy research, new product development, advertising testing, and advanced modeling for marketing decision optimization. For over 40 years, the firm has delivered competitive advantage to clients throughout the world in consumer-packaged goods, telecommunications, retail, technology, medical, and automotive industries.
Media Contact
Cristi Allen
Publicity
Email: callen@decisionanalyst.com
Phone: 1-800-ANALYSIS (262-5974) or 1-817-640-6166
Address: 604 Avenue H East
Arlington, TX 76011
Download the PDF File
Library
Logos & Images
If you are doing a story on Decision Analyst or using any of our published data, news releases or articles, you must cite "Decision Analyst" as the source of the information.
If you use any of the charts or tables from the press releases or other published materials, please email Cristi Allen at callen@decisionanalyst.com to let us know which graphics you took and for what newspaper, magazine, or website it was used.